Somebody has truly said that a picture worth thousand of words. However the same thing is applicable to any graphs, chart or any kind of graphics. So, when the things of matter come to data representation, Bar graphs, Line graphs, Pie charts etc. plays an obvious role in communicating and representing the information as well as establish an intimation among multiple entities.
However, in subject to web-development such kind of chart, flowcharts, diagrams and other graphical aids indulge visitors with visual intimation as well as arrest their attention in order to annotate the useful and relevant material or content brilliantly.
Thus, in this highly trend and modern era of internet technology myriad of online tools are available which are just one click away. These are seems to be very helpful and affable to build flowcharts designs, charts and graphs without meeting any hindrances. However, in coming next section of this A Must have Free Tools For Creating Charts, Flowcharts and Diagrams post I have listed such kind of amazing tools which deliver all the mind maps and graphs to integrate in your own blog or site. So, now let me take you with this below listing where you can opt to implement accordingly which suits your need and requisite excellently.
Barchart

This Barchart is an elegant chart creation tool which help you to create report accompanied with barchart, bar graph and graph image for your data. However, it will be very effective towards intimating your users with eye-catchy graph report and put a positive impact over your visitors. It is also very easy and affable to employ.
![]()
Cacoo

Cacoo is considered as a robust chart and graph creating tool which is quite obvious and useful in generating a wide length of diagrams and flowcharts including wire frames, site maps, network charts, UML and miscellaneous. It is very easy and user friendly online drawing tool in account of which you can accomplish any kind of such task in very handy manner as well as without paying a single penny.
![]()
ChartGizmo

This ChartGizmo is referred as an excellent as well as efficient chart and diagram design tool which allows you to create a chart for your static data or congregated information from your page rapidly. However, in account of CartGizmo’s free account you wouldn’t only build charts and graphs for your blog, website or social networking profiles but you can also put into your website just in a couple of minutes. It will be also worthy for those who wish to display their scientific, financial or any other kind of data.
![]()
CreateAGraph

If you are avid to visualize your data wrapped in graphs and charts then you are at right place. CreateAGraph is literally one amongst renowned chart & graphs creating tool which intimate the data and information to your visitors visually in very handy manner. Therefore, in order to visualize you information and data effectively, it offers five distinct designs of charts and graphs to implement which has been showcased above.
![]()
CSS Chart Generator
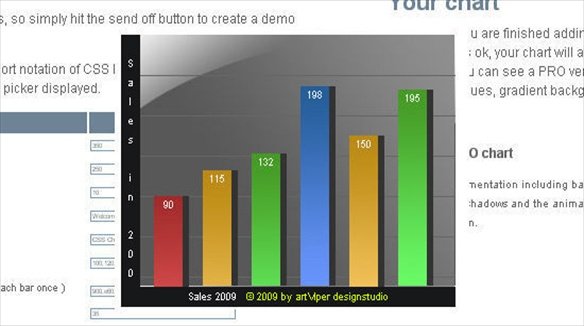
This CSS Chart Generator tool of creating chart and graph is falls under perfect tool which is also referred as an SEO friendly tool. This tool is so simple and convenient to access that you never use like ever before. Simply you are required to put a little bit of efforts to assign the required value in respected input box. Next, click over “Create my Chart” and a snippet code of your data and information will be appear. Simply copy or cut it and paste it at the appropriate place into your blog or website. Moreover, this code is readable by almost every browser even without installing a plugin as well as it will be crawled by search engines in elegant manner.
![]()
DIY Chart

This DIY Chart deliver a perfect and smooth performance in account of its capability to support data streaming and updates even without reloading the web-page as well as buttress the embedded chart in your website or blog just by means of copying the HTML code and paste it. It incorporates several professional templates as well as show real time preview when you are supposed to reconcile the attributes and parameters. You can designate here a plethora of designs for chart types like column, Stacked Bar, Area, Pie, Funnel, Line, Combination and much more.
![]()
Flowchart
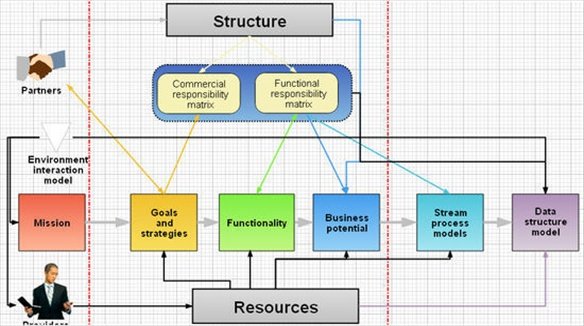
No any other flowchart creating tool would be so effective as this Flowchart. This efficient tool allows you to conspire with your all colleagues in real time. However, it enables you to design and create a flowchart online through conferring with all collaborating users/colleagues in the mean time. Beyond this, it doesn’t requisite to download any software and supported by almost all web-browsers like IE, Firefox, Chrome, Safari, Opera etc. as well as all operating system.
![]()
Fooplot

With this robust Fooplot chart and graph creating tools you can accomplish plot and graph equations online incorporating circles, lines, cubics, parabolas etc.
![]()
Gliffy

With this superb chart & graph creating tool you can excellently create best and professional quality diagrams, flowcharts, technical drawings, floor plans and many more. It is very easy and convenient to access just you are required to drag-and-drop the desired shapes through an integrated library as well as perform formatting just in account of point-and-click. Also, it doesn’t require any skills and expertise. Moreover, it facilitate you to collaborate and share and diagram instantly.
![]()
Grapher
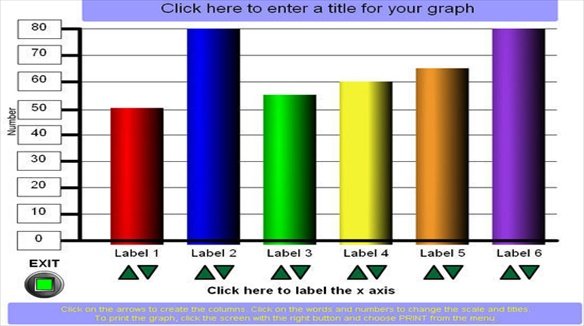
You will never got so easy and handy tool for visualize your data or information in graph. It is just a template containing boiler text where you have to simply click and specify the parameters. On the other hand, in context to visualize the height of graph you can perform only by employing mouse click. Very impressive to create graph your data in just a couple of minutes.
![]()
HighCharts

This HighCharts drawing, graph and chart creating tool is referred as one most captivating online tool and is a charting library which is written in pure JavaScript and provide interactive and intuitive charts for your web-application and website. In this current era, it is supported by spline, line, column, pie, bar, area, area spline and scatter chart types.
![]()
Hohli Charts

With this stunning tool for creating chart, graphs and diagrams you can create diversified design of graphs and charts dynamically in very handy manner. Simply, you have to put a little bit efforts to select the chart or graph style through which you want to visualize your data and put the parameters in specified input box. You done it.
![]()
MGraph

This MGraph also called as Ajax MGraph is an amazing online graph creating tool which flaunts on Prototype.js and referred as purely written in XHTML/CSS Graph. It is user interactive and supported by Opera, Firefox and Internet Explorer.
![]()
PieColor
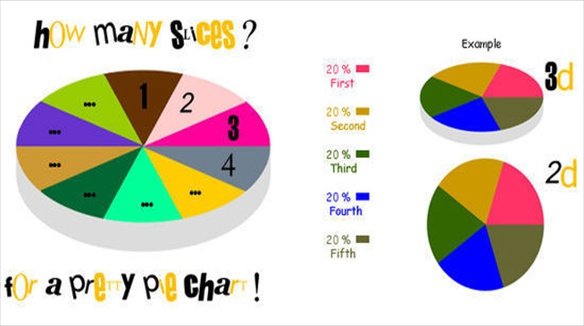
This is another most simple and convenient online chart creating tool helpful to visualize your data in pie chart. Simply, you are required to input the value including other parameters in the specified box and get the image of your data in the look of pie chart. Moreover, once you created your chart you can download it and implement anywhere you wish to display or share.
![]()
SmartDraw

With this amazing chart and graph creating online tool you can create Pie charts, Relative value charts, line graphs and many more dynamically. Moreover, it enable you to enjoy a new level of graphs and charts in account of automating the layout design as well as provide far flexibility rather than Excel. Also, it is referred as a most having tool who are avid to visualize their data or information.
![]()
XML/SWF Charts

XML/SWF Chart is a simple tool to create graph and charts online through XML data. It incorporate a wide length of gallery through which you can opt to create desired designs and layout for creating graph and charts as well as visualize your data. However, XML deliver affable data generation as well as Flash deliver best quality of graphics.
![]()
yEd Graph Editor
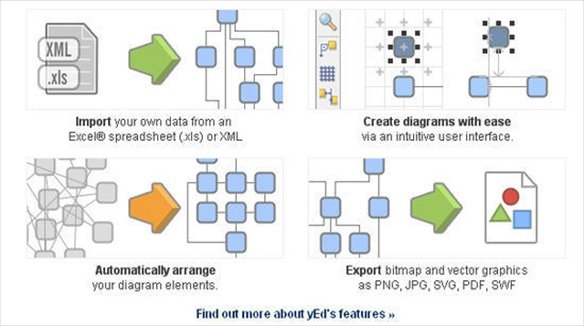
yEd is a robust desktop application useful to create high-quality graphs, charts and diagrams very effectively and exponentially. It allows you to create your diagram either manually or by importing the data from any external sources. Moreover, it is accompanied by an automatic layout algorithms which is capable to cultivate even large sets of data just in account of clicking a button.
![]()
Hopefully, this post A Must have Free Tools For Creating Charts, Flowcharts and Diagrams would be proved as highly worthy and useful for you towards the endeavor of visualizing your any kind of information or data. These online tools for creating graph, chart and diagram are simple and handy to access that it doesn’t require any skills. However, also useful for those users who wish to save their ton of precious time and efforts. Also, you can share the diagram online with your collaborated colleagues in real time.

