Chatting! Sharing! Likes! Comments! Friendship! Games! Pages! Yup you are right- I am talking about Facebook. Facebook is the most popular social networking hub on Earth or may be on Milky Way or may be on the whole universe. The Journey of Facebook doesn’t carry a long story behind but in the last 7 years or correctly last 4 years; Facebook has created a saga of success and fame.
Everyone wants to know about Facebook, the story behind, the current statistics, the overall growth, future prospectus, shares, about Mark, about Rinniee (sorry that’s me). So where to get these information? By reading thousands of blogs or watching hundreds of videos? The answer could be a yes if you haven’t click this blog but as you are up then this blog will tell you everything about Facebook.
You must have heard about infographics. Ya the pictures that looks interesting; yes they are those pictures that incorporates a lot of information; yup they are designed after a lot of surveys and data collection; Ok Enough I know you have got what Infographics are. So in this post of mine; I had collected the best 10 latest Facebook Infographics. These all Facebook infographics are designed on different themes and surely incorporates amazing information and statistics in them.
Enough of chit-chat! So let’s begin the show now.
Battle of the Sexes
Battle of sexes is the most popular debate in every category. So who won the battle in the genre of Social Networking websites? In this cool infographics; you will find the answer of the question. According to the data statistics, Facebook and Twitter are dominated by the Female users whereas Google+, Linkedin and Reddit are subjugated by the male users.
Facebook Mobile Statistics
Very shocking news came from the Facebook user statistics that around 57% of the Facebook users Log in to their account from their mobile devices. With this infographics you can get the complete information regarding the Facebook Mobile Statistics.
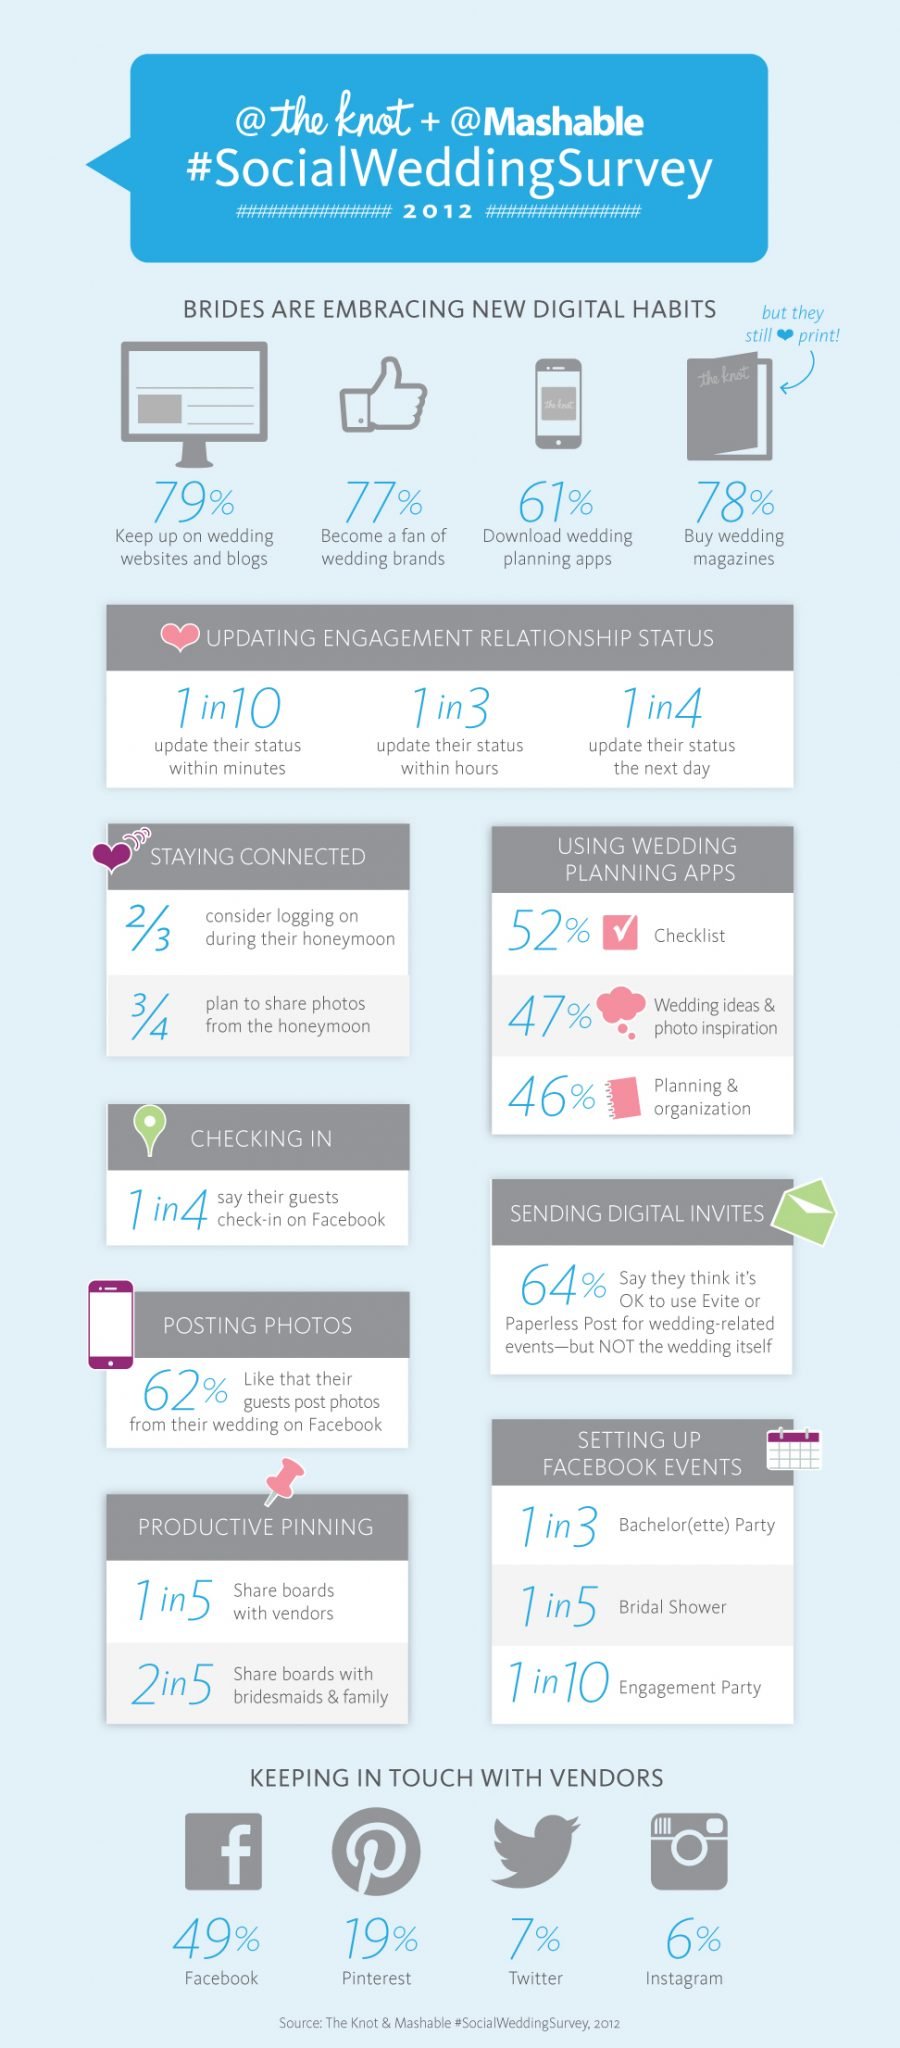
Social Wedding Survey
Social Networking Websites had surely affected the daily lives of the users. Facebook has become the favorite hub to share the happenings with friends and family. In this best Facebook Infographics; the designers had interestingly showcased the effect and popularity of Social Networking websites in Marriages and the related businesses.
Facebook Dissecting The IPO
IPO or Initial Public Offering is the stage when a company starts selling the stock to the Public. If you too are planning to invest your money on Facebook then there are certain important statistics that you must look before investing. With this useful Facebook infographics you can learn the latest Revenue and IPO statistics of the Facebook.
Facebook Psychology – The Addiction
It will not be a very rare case if you or your friend is habitual of checking the Facebook account again and again. According to the Psychologist; this situation or state is called Internet addiction. In many countries this psychological disturbance is treated by the specialist psychologists. If you think that you too are one of those Internet addicts than this rare Facebook infographics will provide you the detail knowledge of the subject.
The Impact of Facebook on Brand’s Sales
Whether it is the Facebook Advertisements or Facebook Application Development; Facebook is one of the most trendy and effective platform to boost up the businesses. In this useful Facebook infographics; you can easily calculate the effect of Facebook on Brand’s sale.
Facebook Power Users
Facebook Power Users! Never heard about the term? Actually they are a particular section of Facebook users which are likelier to indulge in the Facebook activities (commenting, linking, sharing etc) as compare to the regular users. By this infographics you can easily see the behavior and statistics of these Power users and then can target these users more effectively for your business.
Social Media Week Survey Results
This is a very amazing Social Networking Infographics in which Betapond has compiled a lot of interesting statistics about different social networking websites including Facebook, Twitter, Google+, Pinterest and many more.
Facebook In 2012
This is simply one of the Best Facebook infographics from the collection. In this infographics; a lot of useful and interesting information about the statistics of Facebook during last year 2012 is provided in a very attractive manner.
Time Spent Statistics
Want to know how much time is spent by the users on different social networking websites? Just go through this attractive Facebook infographics to get the answers for all your queries.
Conclusion
I hope you would have collected lot information from this collection of Best Facebook Infographics. Please feel free to provide your valuable feedback about my work. Keep visiting Webgranth for more informational blogs and amazing freebies.


Comments
0 comments